Intro
Here are some good examples of how to generate gauge plots including multiple gauge plots in R found at stackoverflow. My use case, however, requires the ability to vary the number of plots based on the number of metrics fed into the function without having to adjust the code. Below is such a function that borrows from these examples and leverages ggplot2::facet_wrap.
Gauge Plots with Facet Wrap
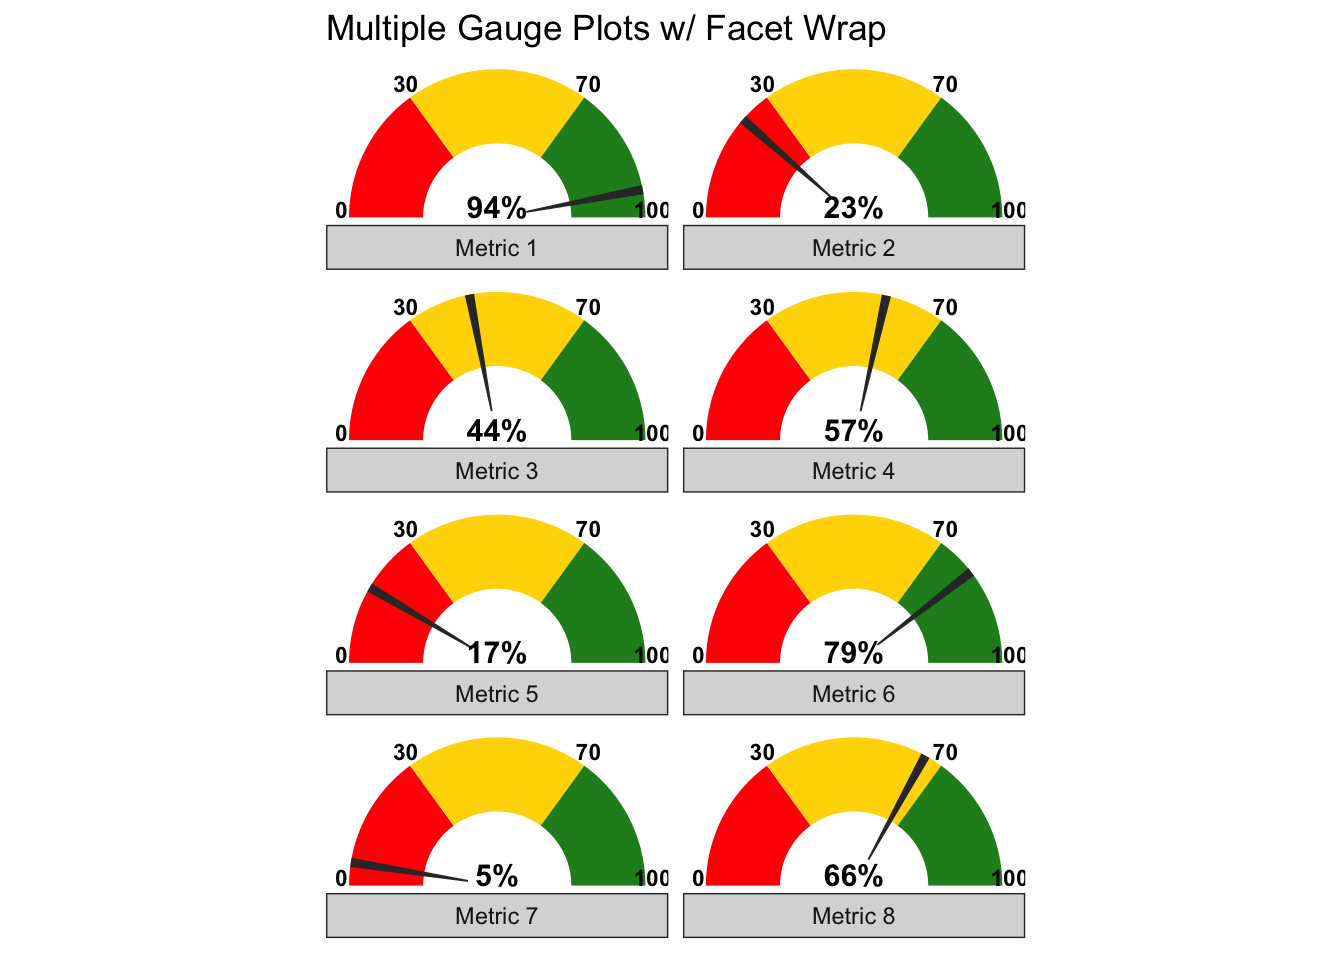
My data is captured in a table with a column “pos” for the position of the needle, and “metric” for the name of the metric.
| pos | metric |
|---|---|
| 94 | Metric 1 |
| 23 | Metric 2 |
| 44 | Metric 3 |
| 57 | Metric 4 |
| 17 | Metric 5 |
| 79 | Metric 6 |
| 5 | Metric 7 |
| 66 | Metric 8 |
The gauge_plot() function takes three parameters. The first is the two-column data frame that has variables “pos” for the needle position, and “metric” for the name of the metric. The second optional parameter allows you to change the breaks. The final parameter controls the number of columns generated by facet_wrap().
Here is the output that captures the 8 metrics in two columns with the default breaks.
The Code
Here’s the code for the function.
gauge_plot <- function(vals, breaks=c(0,30,70,100), ncol= NULL) {
    require(ggplot2)
    require(dplyr)
    require(tidyr)

    if (!is.data.frame(vals)) stop("Vals must be a dataframe")
    if (!dim(vals)[2]==2) stop("Vals must have two columns")
    if (!is.numeric(vals$pos)) stop("Dataframe variable pos must be numeric")


    # function to generate polygons
    get_poly <- function(a,b,r1=0.5,r2=1.0) {
        th.start <- pi*(1-a/100)
        th.end <- pi*(1-b/100)
        th <- seq(th.start,th.end,length=100)
        x <- c(r1*cos(th),rev(r2*cos(th)))
        y <- c(r1*sin(th),rev(r2*sin(th)))
        df <- data.frame(x,y)
        return(df)
    }


    # create the segments based on the breaks
    segments <- list()
    seg_names <- tibble(x = c("a", "c", "e"), y = c("b", "d" ,"f"))

    for(n in 1:3){
        i <-breaks[n]
        j <-breaks[n+1]
        df <- get_poly(i, j)
        names(df) <- seg_names[n,]
        segments$df[[n]] <- df
    }

    dfs <- bind_cols(segments)

    # create set of segments for each metric
    pnt <- tibble()
    for (name in vals$metric){
        pnt[1:nrow(dfs), name] <- name
    }

    dfp <- dfs %>%
        cbind(pnt) %>%
        pivot_longer(-c(a:f), names_to = "metric") %>%
        select(-value)

    # generate the needles
    needles <- list()
    for(p in 1:nrow(vals)){
        i <-vals$pos[p] - 1
        j <-vals$pos[p] + 1
        r1 <- 0.2
        df <- get_poly(i, j, r1)
        df$metric <- vals$metric[p]
        needles$df[[p]] <- df
    }

    dfn <- bind_rows(needles)


    # graph
    ggplot()+
        geom_polygon(data=dfp, aes(a,b), fill="red")+
        geom_polygon(data=dfp, aes(c,d), fill="gold")+
        geom_polygon(data=dfp, aes(e,f), fill="forestgreen")+
        geom_polygon(data=dfn, aes(x,y))+
        geom_text(data=as.data.frame(breaks), size=3, fontface="bold", vjust=0,
                  aes(x=1.05*cos(pi*(1-breaks/100)),y=1.05*sin(pi*(1-breaks/100)),label=breaks))+
        geom_text(data=vals, aes(x=0,y=0), label=paste0(vals$pos,"%"), vjust=0, size=4, fontface="bold")+
        coord_fixed()+
        theme_bw()+
        theme(axis.text=element_blank(),
              axis.title=element_blank(),
              axis.ticks=element_blank(),
              panel.grid=element_blank(),
              panel.border=element_blank()) +
        facet_wrap(~metric, strip.position = "bottom", ncol = ncol) +
        labs(title = "Multiple Gauge Plots w/ Facet Wrap")
}